The U.S. States Where Your Flight Is Most Likely to Be Delayed

Nearly 1 in 4 flights across the U.S. run late or are canceled, according to data from July 2024 to June 2025. In some states, disruption rates are as high as 27.3% of total flights. For travelers, this can lead to missed connections, unplanned overnight stays, and hundreds of dollars in unexpected out-of-pocket costs.
We analyzed national aviation data and cross-referenced it with our internal Tin Leg travel insurance claims data to reveal:
- Where flight delays or cancellations are most likely to occur
- How much could you expect to pay out of pocket if you are disrupted
Armed with this data, you can plan, avoid expensive surprises, and enjoy stress-free travel.
Key Takeaways:
- West Virginia, New Jersey, Virginia, Kansas, and Florida have the highest rate of delayed and cancelled flights in the entire nation.
- Hawaii, Utah, Idaho, Oregon, Montana, and Arizona are the states with the fewest flight disruptions.
- The most delay-prone airports are Orlando Sanford International (Florida), St Pete-Clearwater International (Florida), Aspen Pitkin County Sardy Field (Colorado), Palm Beach International (Florida), and Newark Liberty International (New Jersey).
- Summer is the worst season to travel for delays and cancellations, followed by Spring and Winter, with Fall being the best season.
- Our internal travel insurance claims data reveal that flight disruptions result in expensive headaches for travelers, with the average insurance payout reaching $5,511 for trip cancellations and $2,707 for trip interruptions.
- Consider comprehensive flight insurance that includes coverage for trip cancellations, interruptions, delays, and missed connections.
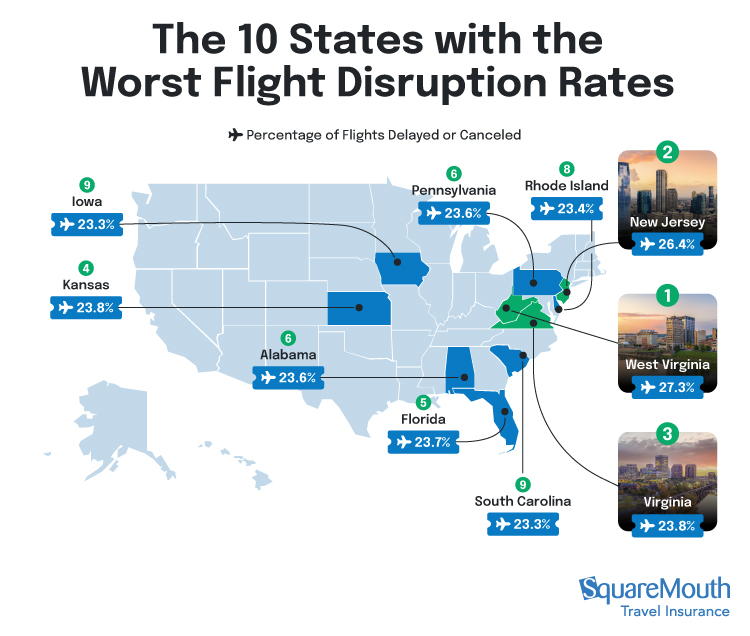
The 10 States with the Worst Flight Disruption Rates
These states had the highest rate of flight disruptions in all of the U.S.:
| Rank | State | % Delayed Flights | % Canceled Flights | % Delayed or Canceled Flights |
| 1 | West Virginia | 24.9% | 2.5% | 27.3% |
| 2 | New Jersey | 24.0% | 2.5% | 26.4% |
| 3 | Virginia | 22.0% | 1.9% | 23.8% |
| 3 | Kansas | 21.6% | 2.1% | 23.8% |
| 5 | Florida | 21.9% | 1.8% | 23.7% |
| 6 | Pennsylvania | 21.9% | 1.7% | 23.6% |
| 6 | Alabama | 21.6% | 2.0% | 23.6% |
| 8 | Rhode Island | 21.9% | 1.5% | 23.4% |
| 9 | South Carolina | 21.2% | 2.1% | 23.3% |
| 9 | Iowa | 21.7% | 1.6% | 23.3% |
West Virginia | 27.3% of Flights Delayed or Canceled
If you’re flying to or from West Virginia, expect to face the highest chance of disruption in the country. Nearly 3 in 10 flights (27.3%) leave late or don’t depart at all in West Virginia.
Even though WV is a rural state with regional airports, the mountain terrain and unpredictable weather make flight schedules harder to maintain. Because airports here are smaller, a storm or technical problem can disrupt flights across the entire state.
Interestingly, the average travel delay claim amount is just $226 for people living in West Virginia, which is the 4th lowest in the U.S.
New Jersey | 26.4% of Flights Delayed or Canceled
Once again, New Jersey lives up to its reputation for being a state with the most flight disruptions in the country. Data from July 2024 to June 2025 shows that more than 1 in 4 flights (26.4%) from New Jersey airports are delayed or canceled. Despite recent upgrades, Newark Liberty International continues to be one of the most delay-prone airports in the country, coming in at number 5.
It’s no surprise, then, that travelers from New Jersey record the highest average travel delay claim amount in the country at $751.
Even minor hold-ups can cascade through airports, and fog, snow, and runway congestion frequently slow operations. If you’re connecting through New Jersey, build in extra time and protect your trip with comprehensive travel insurance that includes missed connection coverage. These policies can help you recover costs if you miss your connecting flight or need to stay overnight.
Virginia and Kansas | 23.8% of Flights Delayed or Canceled
Virginia and Kansas are tied in 3rd place for the most delayed states. From July 2024 to June 2025, both states had 23.8% of all scheduled flights marked as canceled or delayed.
Travelers using airports in Virginia and Kansas can expect some of the highest rates of disruption in the country. Out of the roughly 68,000 flights scheduled in Virginia during this period, around 22% were delayed, and nearly 2% were canceled. The mix of heavy business travel around Washington, D.C., and seasonal coastal weather makes it an unpredictable state for flight reliability.
Kansas tells a similar story, with just under 18,000 scheduled flights and comparable rates of delays and cancellations. Weather systems sweeping across the Midwest and the state’s smaller airport network both contribute to its travel challenges.
Although both states have the same rate of disruptions, due to the overall volume of flights, Virginians file almost triple the number of travel delay claims as people from Kansas. The average cost is much higher, too, at $544 vs. $374.
Florida | 23.7% of Flights Delayed or Canceled
Florida rounds out our list as the 5th-worst state for flight delays and cancellations in the United States. From July 2024 to June 2025, 23.7% of all flights in Florida faced disruptions.
This may not come as a surprise to many, as Florida is home to some of the most popular travel destinations in the United States. With its beautiful beaches and bustling theme parks attracting foreign and domestic visitors, it’s a state with high air traffic.
Our research also revealed that Florida is home to 3 of the worst airports in the United States in terms of flight disruptions, which likely plays a role in how it performs overall. Although Miami Ft. Lauderdale Airport is not among the top 10 worst-performing airports, it has a rate of 23.7% canceled or delayed flights versus the national average of 21.7%.
All of this costs travelers money. Travel insurance claims data for Florida residents show that these disruptions cost the average Floridian $523 in out-of-pocket costs for delayed flights.
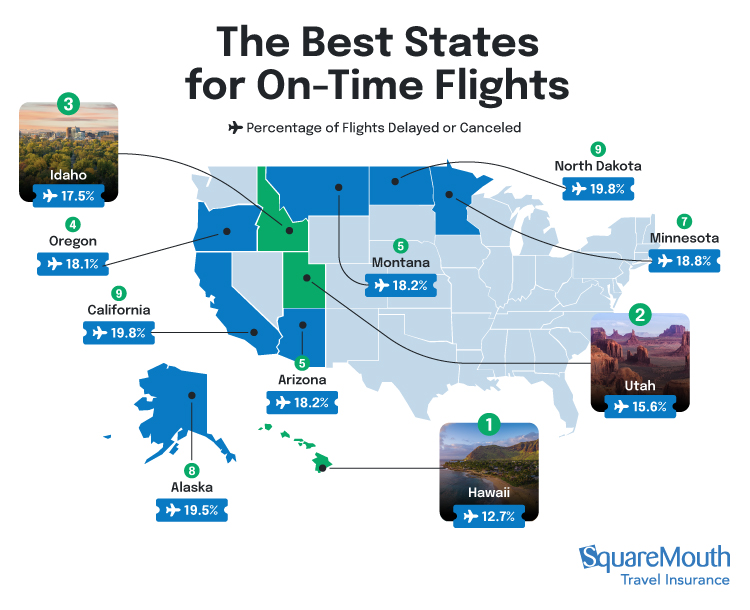
The Best States for On-Time Flights
The following states have the fewest flight disruptions in all of the U.S.:
| Rank | State | % Delayed Flights | % Canceled Flights | % Delayed or Canceled Flights |
| 1 | Hawaii | 12.0% | 0.7% | 12.7% |
| 2 | Utah | 15.0% | 0.6% | 15.6% |
| 3 | Idaho | 17.0% | 0.4% | 17.5% |
| 4 | Oregon | 17.3% | 0.8% | 18.1% |
| 5 | Montana | 17.7% | 0.5% | 18.2% |
| 5 | Arizona | 17.6% | 0.6% | 18.2% |
| 7 | Minnesota | 17.9% | 0.9% | 18.8% |
| 8 | Alaska | 18.2% | 1.3% | 19.5% |
| 9 | North Dakota | 19.0% | 0.8% | 19.8% |
| 9 | California | 19.1% | 0.8% | 19.8% |
Hawaii | 12.7% of Flights Delayed or Canceled
By and large, Hawaii has the smoothest air travel in the country. Fewer than 13% of the 126,875 scheduled flights were delayed or canceled between July 2024 and June 2025. This is a whopping 2.9 percentage points better than Utah, which comes in 2nd place.
Efficient airport operations and generally stable weather help keep flights on schedule, even with high volumes of tourism traffic.
However, the average flight delay claim in Hawaii is $478, showing that when events do cause disruption, costs can quickly add up.
Utah | 15.6% of Flights Delayed or Canceled
Your odds of a smooth departure or arrival in Utah are the 2nd-best in the nation. This state sees a similar number of flights to Hawaii, at 123,058 over the year, and 84.4% of flights arrive and depart on time.
While the percentage of delayed flights is higher than in Hawaii, at 15.0%, the rate of canceled flights is actually slightly lower, at 0.6%.
But when delays do happen, they tend to be more expensive for travelers in Utah. The state has an average flight delay claim of $569, which is the 5th highest in the US.
Idaho | 17.5% of Flights Delayed or Canceled
Idaho doesn’t often make headlines for air travel…and that’s a good thing. For every 5 flights, only 1 is delayed or canceled.
The state’s flight volume is lower than that of many of the major hubs, with 38,176 scheduled flights between July 2024 and June 2025. Fewer aircraft movements mean less congestion in the skies and on the ground, which helps keep schedules running reliably. While 17.0% of flights experience delays, the cancellation rate is just 0.4%, among the lowest in the country.
That reliability is reflected in the cost of disruptions as well. The average flight delay claim in Idaho is $342, the 9th lowest in the country.
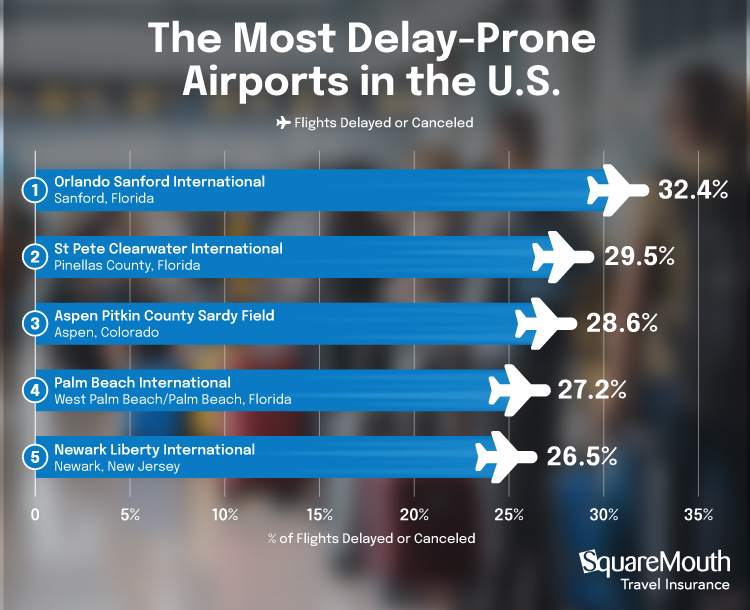
The Most Delay-Prone Airports in the U.S.
These are the 10 worst airports for flight disruptions in the United States:
| Rank | Airport | City | State | % Delayed Flights | % Canceled Flights | % Delayed or Canceled Flights |
| 1 | Orlando Sanford International | Sanford | Florida | 30.8% | 1.6% | 32.4% |
| 2 | St Pete-Clearwater International | Pinellas County | Florida | 27.2% | 2.4% | 29.5% |
| 3 | Aspen Pitkin County Sardy Field | Aspen | Colorado | 25.4% | 3.2% | 28.6% |
| 4 | Palm Beach International | West Palm Beach/Palm Beach | Florida | 25.7% | 1.5% | 27.2% |
| 5 | Newark Liberty International | Newark | New Jersey | 24.1% | 2.5% | 26.5% |
| 6 | Ronald Reagan Washington National | Washington | District of Columbia | 23.0% | 3.0% | 26.0% |
| 7 | Roanoke Blacksburg Regional | Roanoke | Virginia | 23.9% | 1.9% | 25.7% |
| 8 | Augusta Regional at Bush Field | Augusta | Georgia | 22.3% | 3.3% | 25.6% |
| 8 | Punta Gorda Airport | Punta Gorda | Florida | 24.0% | 1.5% | 25.6% |
| 10 | South Bend International | South Bend | Indiana | 24.4% | 1.1% | 25.5% |
For the 10 worst-performing airports on our list, over 1/4th of flights are delayed or canceled.
Most of these airports serve leisure-focused routes, where seasonal surges and weather disruptions are common.
Regional airports with heavy leisure traffic are among the most delay-prone. At Orlando Sanford International in Florida, for example, almost 1 in 3 flights run late or don’t depart at all (32.4%). For reference, the average rate is 21.7% across the US.
Smaller airports are more vulnerable, often because they have fewer runways, limited gate space, and less flexibility to recover when disruptions occur. Florida stands out with 3 of the 10 most delay-prone airports nationwide. High passenger volumes, frequent Summer storms, and strong year-round tourism demand all play a role.
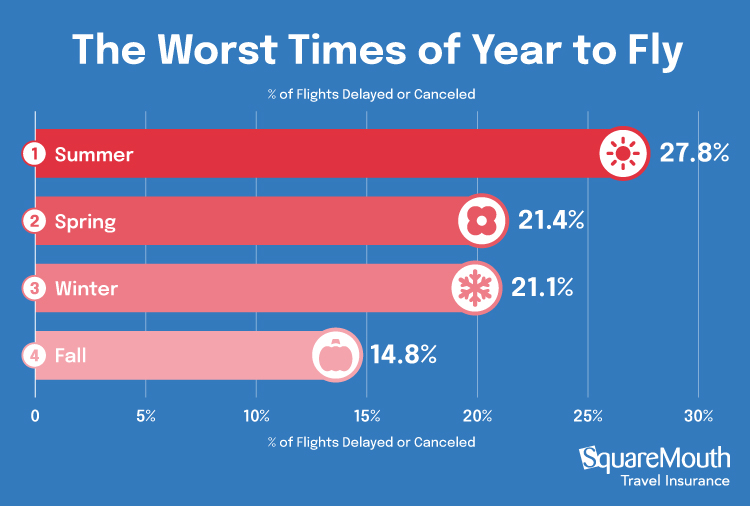
The Worst Times of Year to Fly
The table below ranks each season from the worst to the best time to fly:
| Rank | Season | Flights That Were Delayed | Flights That Were Canceled | Flights That Were Delayed or Canceled |
| 1 | Summer | 25.6% | 2.2% | 27.8% |
| 2 | Spring | 20.4% | 1.0% | 21.4% |
| 3 | Winter | 19.3% | 1.9% | 21.1% |
| 4 | Fall | 14.1% | 0.7% | 14.8% |
The Summer months are the toughest time to travel.
Between June and August 2025, almost 3 in 10 (27.8%) flights were delayed or canceled, the highest seasonal disruption rate of the year. The worst month is July, with 1 in 3 (30.2%) disrupted flights due to air traffic around the 4th of July holiday.
Disruptions begin to climb as early as May (24.1%), coinciding with the start of the Summer travel season, and remain elevated through June (28.9%). Passenger numbers peak during school vacations, airport schedules are stretched to capacity, and severe weather is frequent in some areas, with thunderstorms, hurricanes, and heat-related issues all causing delays.
At the other end of the scale, Fall is the best time to fly. Between September and November (shoulder season), just 14.8% of flights faced disruption, making it the most reliable period of the year. October records the lowest monthly disruption rate (13.7%), as air traffic settles after the busy Summer period.
Interestingly, Winter isn’t the worst season to fly, even with tricky weather conditions. However, there’s a disruption in December, at 21.5%, driven by holiday travel around Christmas and New Year’s.
Spring offers a brief reprieve, with March (20.1%) and April (20.0%) showing moderate reliability before the Summer surge begins again.
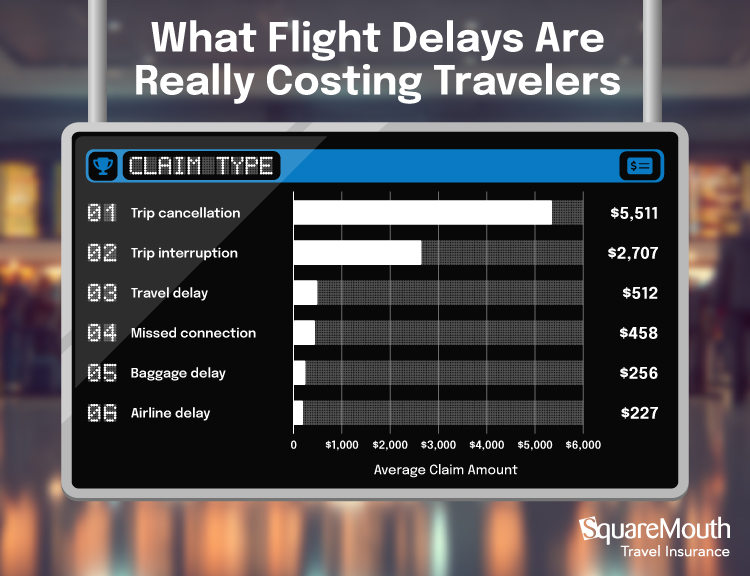
How Much Flight Delays Are Really Costing Travelers
| Rank | Claim Type | Average Claim Amount |
|---|---|---|
| 1 | Trip cancellation | $5,511 |
| 2 | Trip interruption | $2,707 |
| 3 | Travel delay | $512 |
| 4 | Missed connection | $458 |
| 5 | Baggage delay | $256 |
| 6 | Airline delay | $227 |
Our internal data reveals that the most common delays are trip cancellations, which cost travelers an average of $5,511 per claim.
These often cover the full cost of your trip, including non-refundable costs, such as flights, hotel bookings, and prepaid tours, which are lost when a trip can’t go ahead. For this reason, these claims appear much higher than other types of claims on the list.
Trip interruptions also come with a hefty price tag, costing travelers $2,707 on average, according to internal Squaremouth claims data. Trip interruption coverage helps travelers recover the cost of missed nights, rebooked flights, and unused reservations when a trip is cut short or disrupted due to covered reasons and can also help rebook alternate travel arrangements.
Shorter travel delays have an average payout of $512 through travel delay insurance – most commonly used to cover hotel stays, meals, and local transport while travelers wait for a new departure.
And while missed connections might sound like a minor inconvenience, they still average $458 per claim, while baggage delays and airline delays cost travelers $256 and $227 on average.
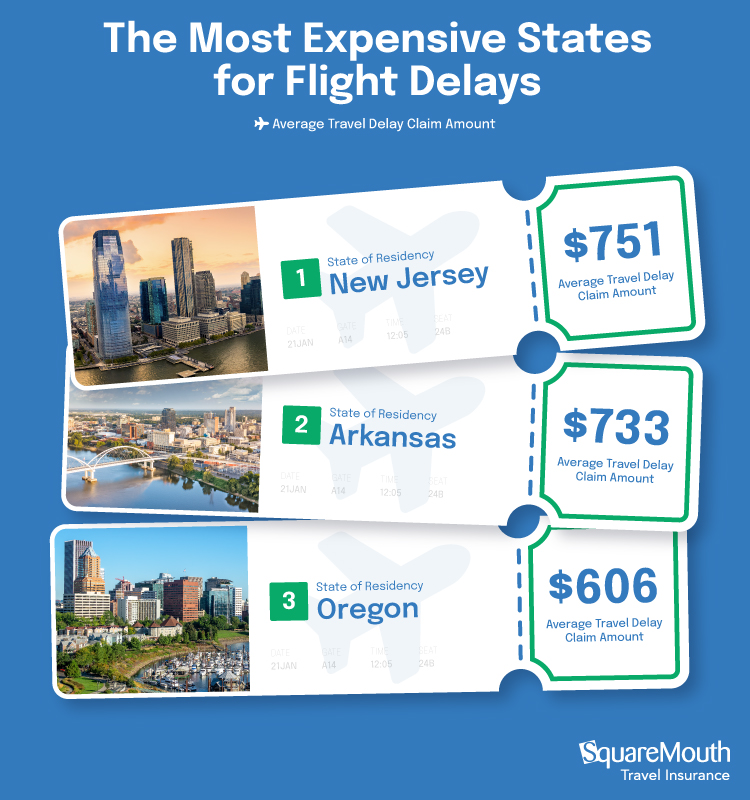
The Most Expensive States for Flight Delays
| Rank | State of Residency | Average Travel Delay Claim Amount |
| 1 | New Jersey | $751 |
| 2 | Arkansas | $733 |
| 3 | Oregon | $606 |
| 4 | Arizona | $582 |
| 5 | Utah | $569 |
| 6 | Illinois | $566 |
| 7 | Connecticut | $554 |
| 8 | Virginia | $544 |
| 9 | Pennsylvania | $542 |
| 10 | Georgia | $541 |
New Jersey is the most expensive state for flight delays, with travelers claiming an average of $751 per disruption, nearly 40% higher than the national average of $512.
After New Jersey, Arkansas ($733), Oregon ($606), Arizona ($582), and Utah ($569) complete the top 5 most expensive states for flight delays.
Our data shows that travelers from New Jersey, Arkansas, and Oregon typically book longer, higher-value international trips, averaging 14 to 20 days and costing between $4,111 and $5,000.
At the other end of the spectrum, Mississippi travelers claim just $125 per delay – the lowest in the country. Mississippi travelers take shorter trips (around 13 days for international trips and 8 for domestic) and are more likely to stay within the U.S. than travelers from places like New Jersey and Arkansas, which limits additional costs such as overnight stays or rebooked long-haul flights.
There’s also a clear pattern between delay frequency and claim cost:
- New Jersey ranks 2nd in the country for overall flight disruption, with 26.4% of flights delayed or canceled, and it also records the highest average delay claim.
- Virginia, another state with high disruption rates (23.8%), ranks 8th for claim value ($544).
On the other hand, Idaho, where delays are less common (17.%%), has moderate claim averages ($342).
How to Protect Yourself Against Travel Disruption
Our Squaremouth Senior Director of Operations, Chrissy Valdez, Shares Tips for a Smoother Trip:
“Flight delays and cancellations are often unavoidable, but their impact on your trip doesn’t have to be. With the right preparation and protection, you can minimize the risk, reduce the cost, and recover quickly if delays occur.
Make sure you’re protected before you fly. Buying travel insurance as soon as you book your trip ensures you are protected in the event of cancellations or delays before you depart.
The right flight insurance can help you recover the cost of hotels, rebooked flights, and missed connections when unexpected delays disrupt your travel plans. These expenses can quickly add up when schedules change, but planning means you can focus on enjoying your trip.
For the best protection, look for plans that cover “any delay of a common carrier,” not just weather delays or mechanical breakdowns. This broader coverage gives you the most flexibility when it comes to delay coverage, which is especially important in recent years with airline disruptions and tech outages becoming more frequent.”
Methodology
Squaremouth is a leading U.S. travel insurance comparison site, helping travelers find the best coverage for every trip. Our platform allows customers to filter plans based on specific coverage needs – including trip cancellation, travel delay, and medical emergencies – with transparent side-by-side comparisons.
As flight disruptions continue to affect travelers nationwide, we wanted to uncover which states experience the most (and least) reliable air travel. In this report, the term “disruptions” refers to flight cancellations and delays.
To do this, we sourced delays and cancellations by state, airport, and month from BTS data, looking at the 12 most recent months available (July 2024 – June 2025).
Note: This data covers major U.S. carriers only (low-cost carriers with <0.5% of revenue excluded). Any duplicate airports were removed.
For each airport, we calculated:
- Total scheduled flights = arrivals + canceled + diverted
- Delayed % = delayed ÷ scheduled
- Canceled % = canceled ÷ scheduled
- Delayed or canceled % = (delayed + canceled) ÷ scheduled
We then also took totals for all airports within each state and for each month.
For the airport ranking, any airports with fewer than 5,000 scheduled flights in 12 months were excluded to ensure statistical reliability.
Data on claims was taken from Squaremouth’s internal Tin Leg Policy claims and shows the number of travel insurance claims by claim type, including the average claim amount.
All data was collected in October 2025 and is accurate as of that date.