58 U.S. Tourism Statistics & Trends

We combined our internal Squaremouth travel insurance data with insights from leading external sources to highlight U.S. tourism trends shaping domestic and international travel in 2025.
Together with expert-led analysis, we reveal how travelers are spending, where they’re going, their travel motives, and how behavior is shifting across the travel landscape.
Key Takeaways:
- Tourism remains one of the most influential sectors in the U.S. economy, contributing an estimated $2.9 trillion and 15 million jobs. Read More
- U.S. travel is growing faster than at any point since the pandemic.
Despite periodic headlines hinting at a slowdown, the latest statistics tell a very different story. In 2025, visitor numbers and trip frequency all surpassed pre-pandemic levels, driven by strong domestic demand and a sharp rebound in both outbound and inbound international travel. Read More - Post-COVID, visitor numbers have recovered faster than traveler spending.
International arrivals now exceed pre-COVID levels, but overseas visitor spend ($190 billion) remains below 2019 ($210 billion), signalling more cautious budgets. Read More - Domestic travel remains a key driver of the U.S. tourism industry.
Americans take around 720 million domestic trips a year, compared with 85.2 million foreign arrivals. That means nearly 90% of all travel in the U.S. is domestic, making it the overwhelming driver of tourism demand nationwide. Read More - Nearly half of all international visitors to the U.S. come from Canada and Mexico.
Canada and Mexico together account for over 37 million of the 77.7 million international visitors to the U.S. in 2024, meaning more than half of all overseas arrivals come from just these two neighboring countries. Read More - Summer brings the highest travel demand and the most disruption.
August sees the highest number of international arrivals, and July has the highest flight-disruption rate (30.2%) across all seasons. Read More - American travelers prioritize leisure travel above all else.
60.6% of Americans travel abroad for vacation and cite shopping as the top activity for international visits once they arrive. Read More - American travelers are risk-aware when traveling abroad.
International trip insurance accounts for 85% of travel insurance plans purchased by Americans through Squaremouth, with travelers citing concerns about medical emergencies and cancellation costs as their primary motivation for purchase. Read More
Follow along as we dive into these data trends and more.
Skip Ahead to Topics We Cover:
- Economic Impact of Tourism
- International Visitors to the U.S.
- Top Reasons People Visit the U.S.
- Domestic Tourism Trends
- Statistics on Americans Traveling Abroad
- U.S. Tourism Statistics by State & City
- Travel Planning & Booking Trends
The Economic Impact of Tourism in America

Travel and tourism are significant economic drivers in the U.S. economy, generating nearly $3 trillion in GDP and employing approximately 15 million workers annually.
Tourism, from both domestic and international visitors, makes up the largest employer in several states and sustains jobs across airlines, hotels, restaurants, attractions, and countless local businesses.
Here is a look at some of the top statistics for how tourism affects the U.S. economy:
1. In 2024, the U.S. travel industry produced about $2.9 trillion in economic output
Overall, tourism accounts for approximately 2.5% of the U.S. GDP, placing it ahead of many traditional sectors, such as agriculture (0.9%), mining (1.3%), and utilities (1.5%).
This contribution makes it a core driver of economic activity in multiple regions nationwide, even affecting local businesses outside of the main tourism hotspots.
The U.S. continues to invest in its travel infrastructure, giving travelers a wide range of experiences and destinations to choose from.
2. Domestic travel for leisure contributed $839 billion to the U.S. economy in 2024
Domestic travel is a boon for the U.S. economy. Americans traveling domestically generate a huge amount of economic impact and contribute around $839 billion to the economy in 2024.
These domestic travelers are also especially important for local businesses in tourism-led states, such as the ones we explore below.
3. Foreign traveler spending was lower than pre-COVID levels at just $190 billion, despite international visitors to the U.S increasing in 2024
International tourists spent $190 billion in the U.S. in 2024, a $30 billion increase from 2023, but still below the $210 billion recorded in 2019.
Despite visitor numbers having already surpassed pre-COVID levels, total traveler spending remains lower. This suggests travelers are spending less per trip than they did before the pandemic, even as international demand for trips to the U.S.A. rises.
The U.S. remains one of the world’s most expensive destinations, especially in cities like New York, San Francisco, and Miami. Discrepancies between traveler numbers and average spend suggest that visitors recognize the expense of visiting the U.S., and are proactively building buffers into their budgets.
4. The tourism industry provides America with 15 million jobs
Travel is a major American employer. Approximately 15 million American jobs are tied to travel and tourism across various industries, including airlines, hotels, restaurants, and attractions.
Traveler spending directly supports communities and local workforces in several states where tourism is one of the main employment drivers.
5. Travel is the biggest employer in Nevada, Wyoming, and Hawaii
In Nevada, Wyoming, and Hawaii, tourism isn’t just important; it’s the single biggest supporter of local jobs.
This means that visitor spending has a direct impact on the local population, from hospitality and guides to transportation and entertainment. Travelers exploring and spending in these destinations are helping to sustain entire communities.
Visitors To America: Inbound U.S. Travel & Tourism Statistics

Since the end of the COVID pandemic in 2023, international visitors have started returning to the United States at a rapid pace, reflecting strengthened global confidence in long-haul travel.
Neighboring markets like Canada and Mexico continue to dominate inbound numbers, while travelers from Europe and beyond increasingly embark on multi-stop U.S. itineraries.
Below are several standout figures that highlight when and how visitors arrive, how long they stay, and which regions benefit most from the steady rise in international tourism.
1. International tourism to the U.S. will have risen by over 10% between 2024 and 2025
The U.S. welcomed 77.7 million international visitors in 2024, with projections rising to 85.2 million in 2025, which is a year-on-year increase of more than 10%.
What makes this trend particularly notable is that it runs counter to the wider narrative that global travel demand is softening due to geopolitical uncertainty and civil unrest in parts of the world.
Despite these concerns, long-haul travel to the U.S. continues to strengthen, signalling sustained international confidence in the destination.
2. Overseas visitors spend an average of $7,046.68 on trips to the U.S.
Squaremouth data reveals that the average trip to the U.S. costs international travelers a similar amount to what Americans spend on their own overseas trips ($7,317.22), and nearly $2,000 more than the average domestic trip taken by U.S. travelers ($5,078.10).
A U.S. trip is a major financial commitment, with long-haul flights, accommodation, attractions, and internal travel quickly adding to the total cost. Consider protecting your investment with comprehensive travel insurance that can offer full trip cancellation reimbursement.
3. Nearly half of America’s international tourists come from neighboring countries
Over 37.2 million of the U.S.’s 77.7 million international tourists in 2024 came from Canada and Mexico, accounting for 47.88% of the total overseas visitors.
4. Canadians are the top foreign visitors to the U.S., with over 20 million trips in 2024
The U.S. welcomed 20.24 million tourists from Canada in 2024, accounting for around half of the Canadian population (41 million). Mexico is second in the list with 16.99 million tourists visiting the US.
5. The UK ranks as the third-highest for international tourists visiting the U.S.A.
Rounding out the top three for international visitors to the U.S. is the UK, with 4.04 million visitors, but its number is still less than 20% of the number of Canadian tourists.
In fact, the top three European countries visiting the U.S. (the UK, Germany, and Italy) account for 7.15 million visitors, which is less than half the number of visitors from second-placed Mexico.
6. August is the busiest month for international tourism to the U.S.
More than 7.5 million international visitors arrived in the U.S. in August 2025, making it the busiest month of the year for inbound tourism, over one million more than in December, the next highest month.
This spike in demand mirrors the findings of Squaremouth’s report, which shows that summer is the most disrupted season for air travel. Between June and August, 27.8% of flights were delayed or cancelled, with July recording the highest disruption rate at 30.2%.
For travelers, August typically means higher prices, crowded airports, and a greater chance of delays. Visiting in late spring or the autumn shoulder season can offer a smoother experience, as statistics show that flight disruption drops to 14.8%.
7. February is the quietest month for foreign tourists visiting the U.S.
Only 4.64 million international visitors came to the U.S. in February 2025, making it the quietest month of the year and more than half a million below the next lowest month, June (5.28 million).
8. JFK is the busiest U.S. airport for international arrivals
John F. Kennedy International Airport handled 34.8 million international arrivals in 2024, around 11.4 million more than Los Angeles International Airport (LAX), the next busiest at 23.4 million.
This makes JFK the leading gateway for overseas visitors entering the United States.
With such high volumes, travelers can expect busy arrival halls, longer immigration lines, and tighter competition for peak-time flights. Despite high travel volume, JFK does not top the list of most delayed airports.
9. California’s airports collectively welcome the most international passengers
Despite New York’s JFK airport taking the top spot, California as a whole dominates for international arrivals, with two airports in the national top five.
Los Angeles International Airport (LAX) ranks second in the U.S. for most international arrivals at 23.4 million international passengers in 2024, and San Francisco International Airport (SFO) ranks fourth with 15.1 million.
The Top Reasons People Visit the U.S.

Most foreign visitors arrive for leisure, whether for vacations, shopping, events, or family time.
Business and educational travel play a smaller, but meaningful, role.
The following statistics outline the motivations driving inbound travel and their influence on tourism patterns nationwide.
1. Two-thirds of international visits to the U.S. are for vacation
Vacations play a role in 67.9% of trips overall. Over half of visitors to the U.S. (56.8%) say vacations are their main reason for traveling, and for a further 11% it’s a key factor.
2. Less than 20% of international travelers visit the U.S. for work reasons
Nearly two in five (19.8%) visits to the U.S. are for business or professional reasons, while family, friends, or vacations prompt 83% of trips.
3. Only 22% of people visiting the U.S. say their main reason is to see friends or family
Seeing friends and family is a factor in 34.5% of overall visits, but it is the main reason behind 22% of trips to the States.
Visiting friends and family is a secondary driver for most trips, which further highlights that most people are prioritizing leisure and sightseeing when they travel.
4. Two-fifths of U.S. visitors are there for bucket list or big-ticket vacations
According to data from a recent Squaremouth survey, 40% of international visitors view the U.S. as a bucket-list destination, a testament to its enduring global appeal.
If you’re booking bucket-list activities, consider comparing travel insurance plans to ensure your big-ticket trip is fully refundable should you need to cancel for a covered reason.
5. Shopping is the most common activity among international visitors to the U.S.
While vacations are the primary purpose for most trips to the U.S., the activities travelers engage in once they arrive tell a different story.
According to recent International Trade Administration data, shopping is the single most common activity, featuring in 81.3% of all international visits.
| Activity (ranked) | Percentage of visits | Estimated number of visits |
|---|---|---|
| 1. Shopping | 81.3% | 38.8m |
| 2. Sightseeing | 74.9% | 35.8m |
| 3. National parks and monuments | 32.3% | 15.4m |
| 3. Art galleries and museums | 27.7% | 13.2m |
| 5. Small towns and the countryside | 26.9% | 12.9m |
| 6. Amusement and theme parks | 26.4% | 12.6m |
| 7. Historical locations | 25.5% | 12.2m |
| 8. Fine dining experiences | 25.1% | 12.0m |
| 9. Guided tours | 18.1% | 8.6m |
| 10. Sporting events | 14.8% | 7.1m |
For travelers planning shopping-heavy itineraries, consider travel insurance to ensure that high-value purchases are covered in case they’re lost, damaged or stolen.
6. Nearly 32% of all foreign visits to the U.S. are for reasons connected to sports or exercise
Trips to America frequently include sports activities:
- Attending sporting events – 14.8%
- Water sports – 6.1%
- Camping and hiking – 5.0%
- Golfing and tennis – 3.0%
- Snow sports – 1.7%
- Hunting and fishing – 1.2%
7. Almost half of trips to the U.S. involve families of multiple generations
47% of all trips include more than one generation of a family, compared to just 12% of solo travelers.
This can mean higher spending, increased complexity, and more logistics to manage, making it even more crucial to consider travel insurance that can reimburse you for hiccups during your vacation.
U.S. Domestic Travel & Tourism Statistics

Domestic travel remains the backbone of U.S. tourism, with Americans taking far more domestic trips than international ones each year.
With hundreds of millions of domestic trips being taken annually, demand for hotels, flights, activities, and other tourist infrastructure is high, especially across major destinations such as New York City, Las Vegas, Hawaii, and Florida.
The statistics and insights below highlight the core trends in U.S. domestic tourism, from how often Americans travel to the most visited U.S. destinations and how behavior varies across different demographic groups.
1. On average, Americans take 2.1 domestic trips per year
Americans take around 720 million domestic trips each year, which works out to an average of 2.1 trips per person. Domestic travel continues to form the backbone of the U.S. tourism industry, with frequent short breaks, weekend getaways, and regional holidays driving consistent demand.
For frequent travelers, multi-trip or annual travel insurance can often work out cheaper than buying single-trip coverage each time.
2. Domestic travel has increased by over 20% in the last five years
The staycation is growing increasingly popular, as U.S. domestic travel has increased by one-fifth (20.6%) over the last five years.
More Americans are choosing to vacation closer to home, which contributes to greater domestic spending on travel-related service industries.
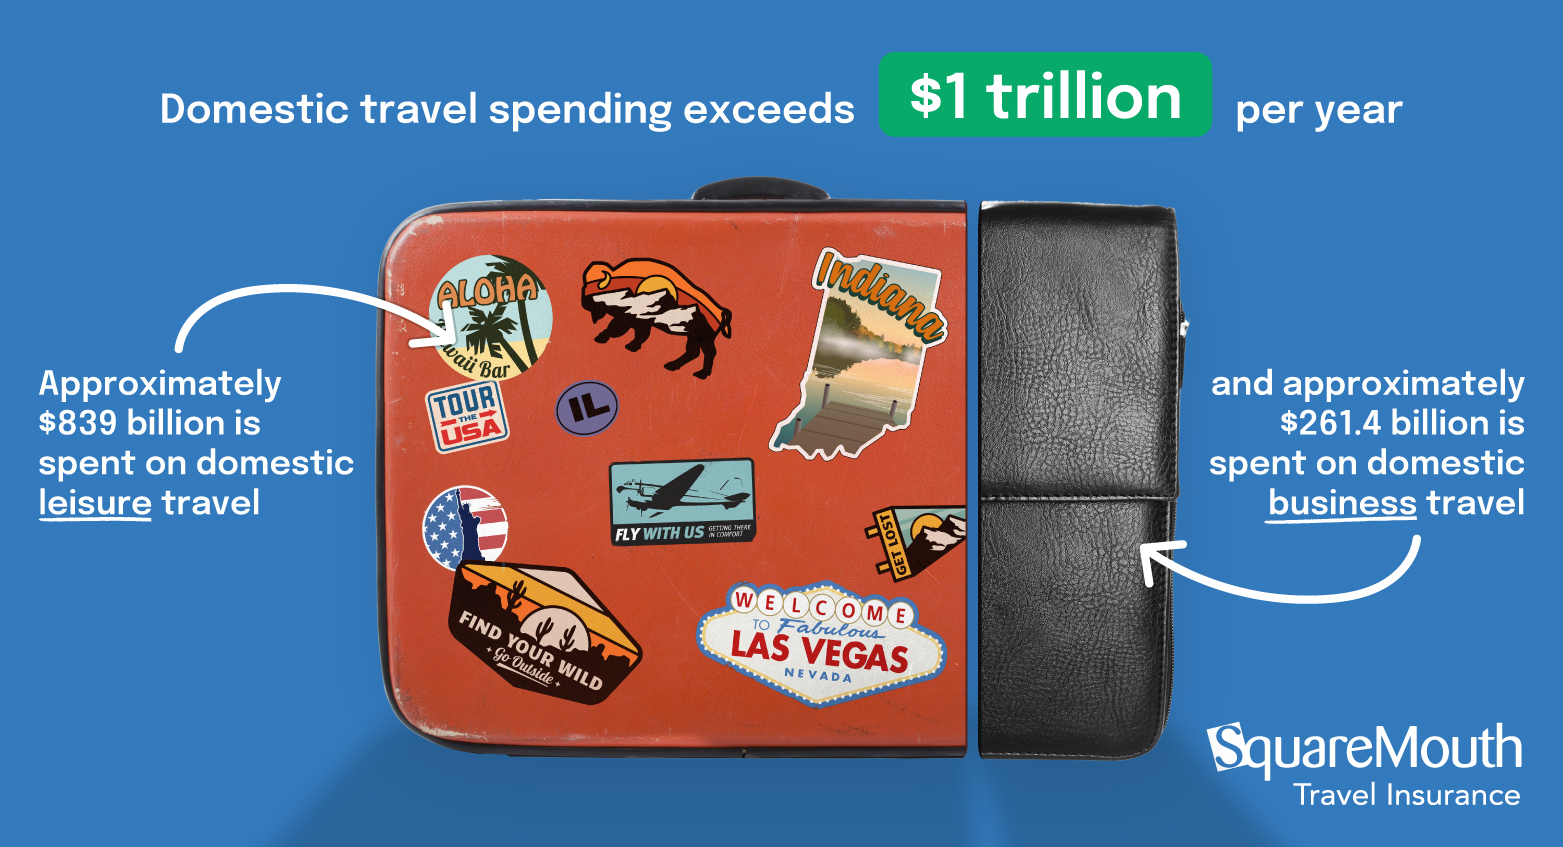
3. Domestic travel spending exceeds $1 trillion per year
Americans spend over $1 trillion on domestic travel annually, with around $261.4 billion of that linked to business trips and $839 billion linked to leisure travel. This underscores the sheer scale of U.S. travel demand and helps explain why prices can rise quickly during peak periods.
Domestic travel spending is a major source of income for several states within the USA, as highlighted in the Economic Impact of Tourism in America.
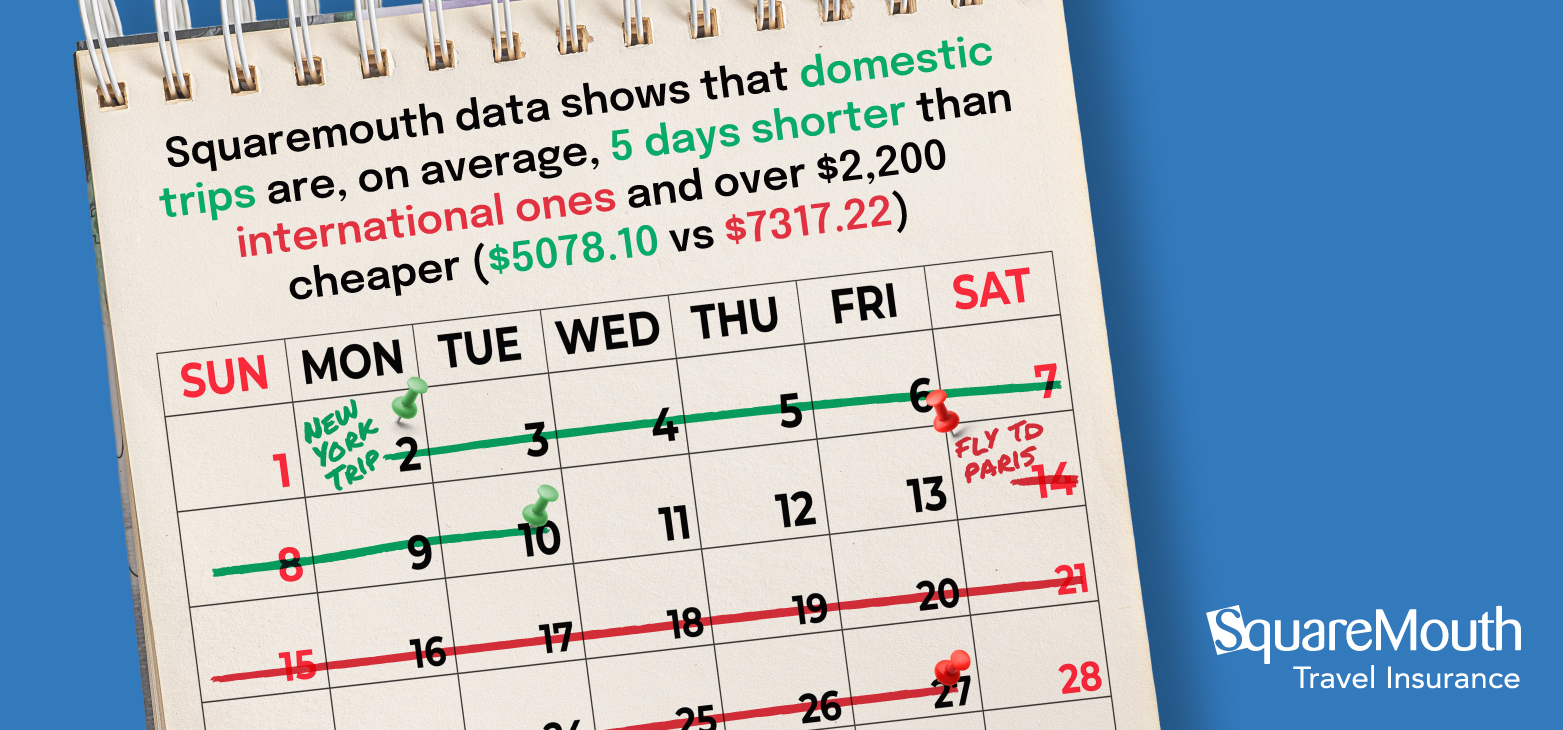
4. Domestic trips are 5 days shorter on average than international trips
Squaremouth data (10/1/2024 to 10/1/2025) shows that domestic trips average 9 days, compared to 14 days for international travel. They are also more affordable, costing an average of $5,078.10, compared to $7,317.22 for international trips.
Even so, domestic travel costs can add up quickly once internal flights, accommodation and activities are factored in. Setting a realistic budget and planning key elements in advance can help keep spending under control.
5. Americans spend an average of $283 for domestic travel insurance versus $447 for international travel insurance
According to Squaremouth data, international plans cost around 57% more than domestic policies.
This price gap reflects the increased trip lengths mentioned above, trip cost insured, and the higher level of protection travelers opt for when traveling abroad.
Since most U.S. health insurance doesn’t extend overseas, most travelers buy international policies with high medical coverage limits and comprehensive cancellation protection, which often makes them more expensive.
Domestic premiums remain lower on average due to lower medical limits, shorter trip lengths, and travelers opting for bare-bones policies. That said, even a relatively low-cost policy can offer valuable financial protection if plans change unexpectedly.
6. New York City, Las Vegas, and Hawaii are the most popular domestic travel destinations
A recent survey on domestic travel destinations revealed that nearly one-third (30%) of Americans said they would consider visiting at least one of these three destinations in the next 2-3 years.
Their appeal spans very different types of travel:
- New York City for culture, food, and iconic attractions
- Las Vegas for entertainment and nightlife
- Hawaii for beaches, nature, and relaxation
Together, they represent the broad mix of experiences Americans prioritize when planning domestic trips.
7. Las Vegas and Nashville top the travel plans of baby boomers
Different age groups favor different types of trips, and for Baby Boomers (born 1946–1964), entertainment-focused cities lead the way.
Nearly one-quarter (24%) of Boomers said they were considering visits to Las Vegas or Nashville, making them the most popular domestic destinations for this age group.
8. New York City and Miami top the travel lists of Gen Z and Millennials
New York City is the leading domestic destination for both Gen Z (44%) and Millennials (39%). Miami follows closely, with 41% of Gen Z and 37% of Millennials considering a trip there.
These patterns highlight how younger travelers favor high-energy, culture-driven destinations, which can lead to particularly busy periods around college breaks and major seasonal events.
Americans Abroad: Outbound U.S. Travel & Tourism Statistics

Americans are traveling abroad in greater numbers, with demand rising in recent years for trips to Europe, the Caribbean, and other long-haul destinations.
Outbound travel has not only recovered but also surpassed pre-pandemic levels, driven by a renewed focus on leisure, cultural experiences, and bucket-list trips.
The statistics below show where U.S. travelers are going, what motivates their journeys, and how their spending patterns differ from those of domestic travelers.
1. The number of Americans traveling abroad has more than doubled post-COVID
In 2024, 107.7 million Americans traveled abroad, representing an increase of 108% compared to 2019 and 9.2% versus 2023.
Despite global macroeconomic trends like inflation making travel even more expensive, Americans’ desire for international travel is back and rising quickly.
2. Europe welcomes the largest number of American travelers each year
4 of America’s top 5 most-visited locations are in Europe, accounting for over 17.5 million visits each year.
3. Mexico, Italy, and the UK are the top international destinations for U.S. travelers
Squaremouth’s travel insurance sales data point to Mexico being one of the most popular international destinations for U.S. travelers, followed by Italy and the UK, accounting for 7.19%, 5.90%, and 5.49% of policy purchases, respectively.
These three destinations consistently account for the largest share of policies sold, reflecting strong U.S. travel demand for beach-led getaways, European cultural trips and city-based breaks.
4. The Dominican Republic and Jamaica are the most-visited Caribbean countries among American travelers
3.63 million Americans travel to the Dominican Republic each year, almost double the 1.84 million who visit Jamaica, making these the two most popular Caribbean destinations based on visitor numbers.
However, among Caribbean destinations, Squaremouth’s travel insurance data shows that customers most frequently purchase travel insurance for The Bahamas, not the Dominican Republic or Jamaica.
Beach-led, all-inclusive vacations continue to drive strong demand in the U.S., and since many Caribbean trips involve higher upfront costs, it is especially important to double-check coverage for cancellations and weather disruptions during hurricane season.
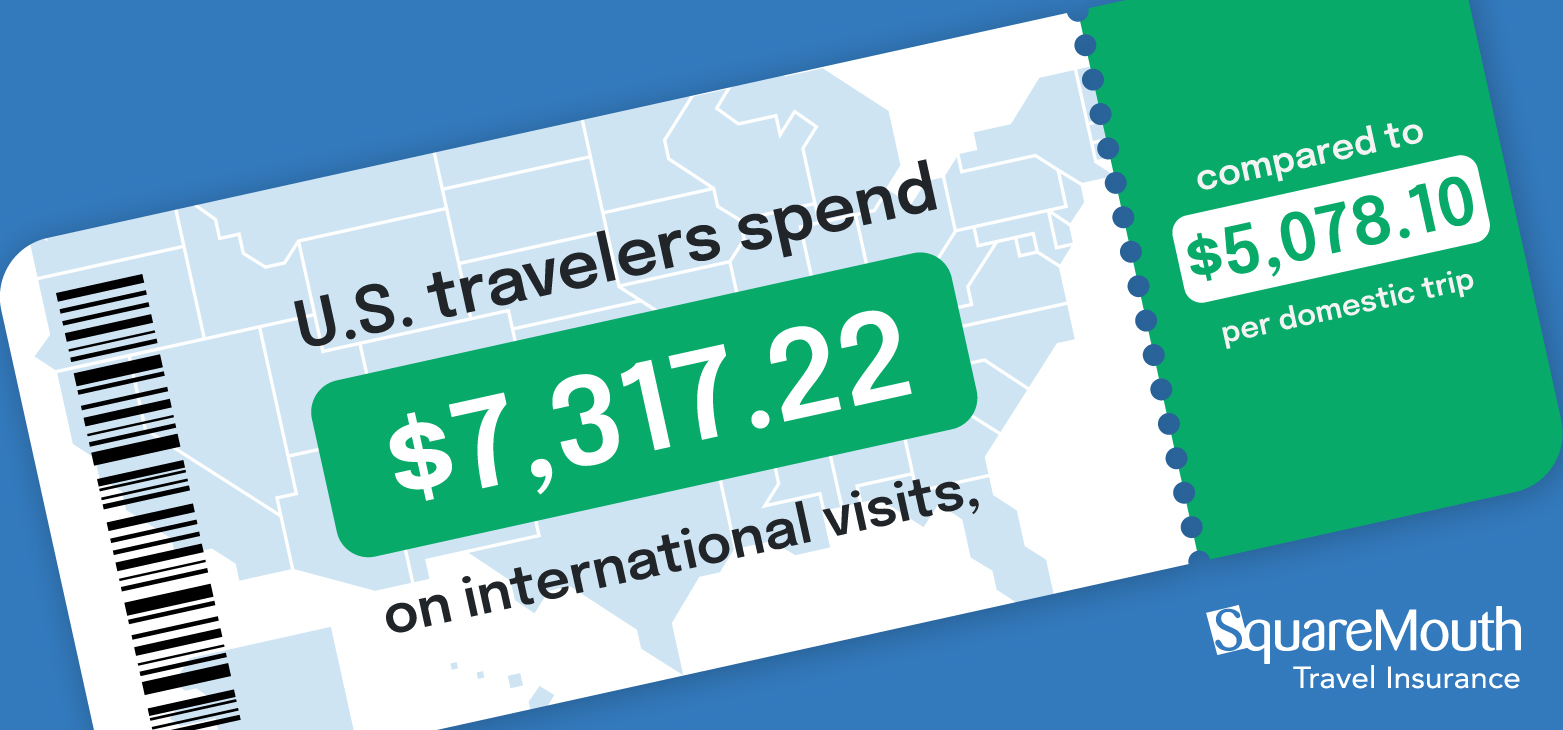
5. On average, per trip, Americans spend an extra $2,239.12 on traveling overseas compared to domestically
According to Squaremouth data, from 10/1/24 to 10/1/25, U.S. travelers spent an average of $5,078.10 per domestic trip and $7,317.22 per international trip.
Due to the high cost of international trips, most travelers opt for a travel insurance plan that can fully reimburse their trip cost if they are forced to cancel.
6. Over 85% of insurance premiums bought by U.S. travelers are for international trips
International travel accounts for 85.97% of travel insurance premiums bought through Squaremouth.
This tells us that most Americans see international trips as higher-risk. In fact, a recent survey from Squaremouth found that 57% of travelers surveyed cited “a medical emergency abroad” as the main factor influencing their decision to buy travel insurance.
If you’re traveling overseas, it’s worth noting that standard U.S. health insurance is not widely accepted abroad. Compare travel insurance plans.
7. Sightseeing is the number one activity Americans do when traveling abroad.
81.5% of Americans cited “sightseeing” as their top planned activity when traveling abroad, regardless of whether they travel for a vacation, to visit family or friends, or for business reasons.
Unlike international tourists traveling to America#3-5, shopping was cited as the second most popular activity for Americans traveling abroad and was featured on 71.5% of Americans’ travel itineraries.
8. 60.6% of Americans cite vacation as their primary motive for travel abroad
Data from the International Trade Administration shows that 60.6% of Americans cite vacation as their main reason for traveling internationally, and 71.0% list it as a purpose of travel overall.
9. Over 33% of Americans travel abroad for sports or outdoor activities
In a recent survey conducted by the International Trade Administration, more than one-third of U.S. travelers said their main reason for going overseas is linked to adventure sports or physical activity.
Popular motives include:
- Water sports – 12.3%
- Camping and hiking – 7.9%
- Sporting events – 7.3%
- Golfing and tennis – 2.3%
- Hunting and fishing – 2.2%
- Snow sports – 1.2%
This mirrors the patterns seen among international visitors coming to the U.S., with a similar share traveling for outdoor or adventure-led experiences.
Whether you’re traveling domestically within the United States or heading abroad, if your trip involves any of these activities, it’s important to check whether your travel insurance covers the specific sports you plan to take part in. Some activities may require additional protection or an upgraded policy.
10. 2.7% of Americans travel abroad for educational purposes
According to recent surveys conducted by the International Trade Administration, only 2.7% of U.S. travelers cite education as their primary reason for traveling overseas, a figure that closely mirrors inbound travel, where 3% of international visitors come to the U.S. for the same reason.
Across both directions, study and educational travel represent a very small share of total trips. As a result, the travel market remains overwhelmingly leisure-driven, with pricing patterns shaped far more by peak vacation seasons than by academic calendars.
Read Squaremouth’s guide to learn more about taking out travel insurance as a student when studying abroad.
11. Business accounts for 6.5% of U.S. trips abroad
Only 6.5% of U.S. outbound travel is for business-related purposes, notably lower than the share of international visitors coming to the U.S. for work.
This 6.5% is split between general business travel (4.5%) and attendance at conventions, conferences, and trade shows (2.0%).
Because business travel accounts for only a small proportion of outbound trips, international travel is still heavily influenced by vacation and leisure travelers.
U.S. Tourism Statistics by State & City

Visitor behavior across the U.S. varies significantly, with major cities and world-famous attractions drawing millions each year while smaller states see far fewer international arrivals. These differences influence everything from hotel availability to regional tourism investment.
The statistics below highlight the most-visited destinations in the country and reveal how travelers distribute themselves across states and cities.
1. New York State welcomes almost 10 million international visitors
9.8 million tourists traveled to New York State last year, more than any other state in the U.S. More specifically, the New York-White Plains-Wayne metro area, which includes New York City, attracted over 9.5 million international visitors.
New York’s popularity means hotels, attractions, and transport can be busy year-round. Booking key experiences and accommodation early is the best way to avoid premium pricing, especially in Manhattan.
2. Neighboring New Jersey welcomes 1.23 million visitors – less than 13% of the number visiting New York State.
Despite sitting right across the river, New Jersey attracts far fewer international tourists than New York. In 2024, New Jersey welcomed 1.23 million overseas visitors — just 12.5% of the 9.8 million who visited New York State in the same period.
3. Florida is America’s second most-visited state
Approximately 8.86 million international tourists visit Florida each year, with Walt Disney World being the Sunshine State’s most popular tourist destination.
The Magic Kingdom welcomes over 20 million international and domestic visitors annually, making it the ninth most-visited attraction in the U.S.
4. Delaware is the least-visited state, with 42,000 international visitors per year
For context, each day, Times Square gets over double the number of international visitors as Delaware does in a year’s time.
In other words, it would take Delaware 1190.47 years to welcome the same number of international visitors as Times Square has visitors per year.
5. Times Square is the most popular tourist attraction in the U.S., with 50 million visitors every year
That’s approximately 136,986 people every day. Meanwhile, Central Park isn’t far behind; 42 million people visit the park each year, which works out at 115,068.
6. The Mall of America is the 4th most visited attraction in the U.S.
With shopping being the most common activity among international visitors (81.3% of trips), it’s no surprise that the Mall of America attracts more than 40 million visitors (international and domestic) each year, making it the 4th most-visited attraction in the country.
The mall’s scale, entertainment offerings, and retail choices make it a major draw for both domestic and international travelers.
7. San Francisco gets over 2x the number of domestic overnight visitors than it does international visitors
In 2024, San Francisco welcomed 5.74 million domestic overnight visitors, compared with 2.34 million international visitors.
San Francisco continues to be a major destination for American travelers who account for the majority of overnight stays in the city.
For travelers, this often means considering travel insurance that covers unexpected delays or cancellations, which can be more common during high-demand periods.
8. Santa Barbara is growing in popularity, with hotel occupancy up nearly 9% and airport passenger traffic rising 11% year-on-year
Hotels in the area have recorded year-on-year occupancy increases of 8–9%, while passenger numbers through Santa Barbara Airport are up 11%.
Together, these figures point to a destination that is growing steadily in popularity, with more travelers choosing the area for its mix of coastal scenery, culture, and year-round appeal.
Travel Planning & Booking Trends in the U.S.
Digital tools, social platforms, and emerging technologies like AI are changing how travelers plan and book their trips.
Data shows that more travelers are taking control of their travel arrangements directly rather than using third-party assistants, but they still rely on expert advice when navigating complex itineraries or travel disruptions.
The following insights explore how different age groups find inspiration, research destinations, and make booking decisions in today’s travel landscape.
1. 52% of global travelers arrange trips without third-party help
Digital tools are giving travelers greater control and more flexibility to book getaways quickly.
This is especially true for younger travelers. Over two-thirds (67%) of 18-34 year-olds now choose to self-book rather than seek help from elsewhere.
This gives travelers more flexibility, but it also means it’s essential to double-check the terms and cancellation rules yourself, rather than relying on an agent to do it for you.
2. 15.99% of travelers have used AI tools to plan travel
Recent data from a Squaremouth survey showed that 15.99% of travelers have used AI tools to help plan travel.
Nearly two-thirds (65%) of people surveyed also said they would use it again.
3. Building itineraries is the most popular reason for travelers using AI tools
Nearly 50% (47.18%) of those surveyed by Squaremouth reported using AI to build their itineraries, with ChatGPT being the most frequently used AI tool.
For tips on how to stay safe when using AI to book travel, read the tips in our guide on how Travelers Are Using AI Without Realizing the Risks.
4. Over 40% of people aged 18-34 get travel inspiration from social media
18-24-year-olds are more likely to turn to social media sites like TikTok or Instagram (42%) than to recommendations from family and friends (39%) when booking their next trip.
5. General internet searches are still the most popular way of looking for vacations
Despite the rise of social and AI search, nearly half of all people (48%) still search the web for their trips, with over half of those aged 45-64 leading the way, compared to 36% of those aged 18-24.
Taking the time to use travel comparison sites, such as Squaremouth, to compare options can save you a significant amount of money.
Data Sourcing
The data and statistics presented here come from a mixture of internal proprietary Squaremouth data as well as third-party data sets.
Squaremouth is the largest travel insurance marketplace in the U.S., having helped millions of travelers find, compare, and purchase travel insurance plans from the world’s most trusted providers. We operate on longstanding principles of transparency and unbiased guidance, which is why we share the latest insights into the state of travel and tourism in the U.S. in this report.
Sources
Squaremouth – Live Travel Insurance Data (last 365 days)
Squaremouth – 2025 Travel Trends: Family Vacations and Bucket List Trips Top Travelers’ Priorities
Squaremouth – Best Domestic Travel Insurance Plans in 2025
Bureau of Transportation Statistics – Total Foreign Arrivals: 2019-2025
Trading Economics – United States Tourist Arrivals
YouGov – Top Domestic Travel Destinations
U.S. Department of Transportation – U.S. International Air Passenger and Freight Statistics
Our World in Data – International tourist trips
International Trade Administration – International Visitor (I-94) Arrivals Program
International Trade Administration – Survey of International Air Travelers (SIAT)
International Trade Administration – December and Annual 2024 Total International Travel Volume
World Bank Group – Population, total – United States
TGM Research – The Rise of the Self-Booking Explorer
International Trade Administration – U.S. States & Cities Visited by Overseas Travelers
International Trade Administration – Travel & Tourism Industry
U.S. Travel Association – Economic Impact of the Travel Industry
San Francisco Travel Association – Visitor Volume and Direct Spending Estimates | 2024
Santa Barbara South Coast Chamber of Commerce – South Coast Data Dashboard
Please note: Data pulled from Squaremouth Live Data, correct as of November 30th, 2025.